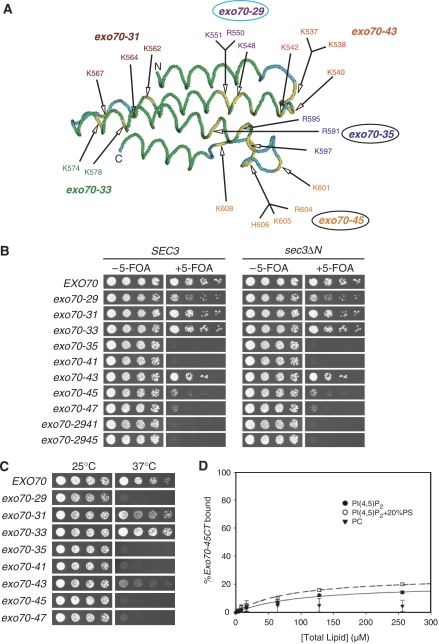
Figure 3.
exo70 alleles with the positively charged residues in Domain D mutated have synthetic growth defect with sec3ΔN. (A) The structure of Exo70 Domain D is illustrated with the green and blue colors specifying α-helices and loop regions in this domain. The yellow color indicates the positively charged residues mutated to alanine in different exo70 mutant alleles. The exo70-35 and exo70-45 alleles (with black circles) with mutations located at the last two α-helices and their connecting loop showed synthetic growth defect with sec3ΔN. The exo70-29 allele (with blue circles) showed a lesser extent of synthetic growth defect with sec3ΔN. The other exo70 alleles did not have any synthetic growth defect with sec3ΔN. (B) Various exo70 mutant alleles were introduced into the sec3ΔN strain, in which the chromosomal copy of SEC3 was replaced by sec3ΔN with intact SEC3 promoter. The exo70 mutants were expressed behind EXO70 promoters in a CEN TRP1 plasmid. The sec3ΔN exo70 double mutants supplemented with a CEN URA3 EXO70 balancer were streaked out on plates in the presence or absence of 5-FOA, and incubated for 5 days at 25°C. The exo70 single mutants (the SEC3 panel, left) were used as controls. Exo70 harbor different mutations in Domain D were tested for growth after losing the EXO70 balancer on 5-FOA plates. A selective set of mutants (exo70-29, exo70-41, exo70-35, exo70-45, exo70-47, exo70-2941, exo70-2945) showed synthetic growth defect or lethality with sec3N. The summary and categorization of all the tested exo70 mutant alleles are listed in Table I. (C) Analysis of the interaction between exo70 mutants and the plasma membrane using the Ras-rescue assay. The rescue of cdc25-ts at the restrictive temperature (37°C) is shown on the right. (D) GST-tagged Exo70-45CT (150 nM) was incubated with various concentrations of LUVs composed of 100% PC, 5% PI(4,5)P2 or 5% PI(4,5)P2+20% PS. The solid and dashed curves are the Best-fit results of the 5% PI(4,5)P2 and 5% PI(4,5)P2+20% PS data to a hyperbolae, respectively. The error bars designate the s.d.; n=3.

