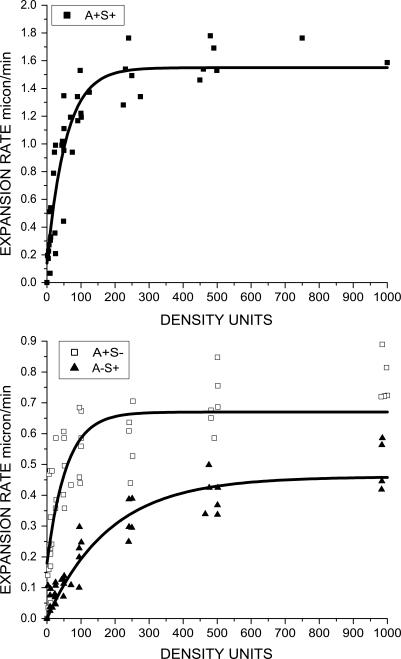
Figure 2. Fitting Curves of Spreading Rates of Wild-Type (A+S+) Myxobacteria and Motility Mutants (Reproduced by Using Data from [10]).
The dots are experimental data points. The fitting functions are as follows: wild-type (A+S+), f(x) = a − b × exp(−x / c), with a = 1.55 ± 0.06, b = 1.41 ± 0.10, and c = 56 ± 10; A+S− mutant, g(x) = a − b × exp(−x / c), with a = 0.67 ± 0.03, b = 0.49 ± 0.05, and c = 57 ± 16; and A−S+ mutant, h(x) = b × (1 − exp(−x / c)), with b = 0.46 ± 0.02 and c = 184 ± 27. The density is in K-S units, and the expansion rate is in microns per minute.

