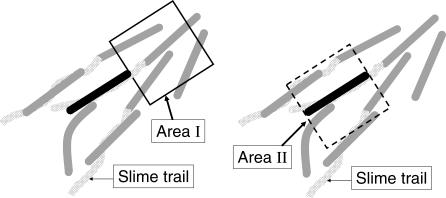
Figure 4. Diagram Showing the Two Types of Social Interactions for a Cell (Black).
Although the pilus length varies with extension, retraction, and breakage, most pili are on the order of one cell length [39]. Area I represents the pilus–cell interaction area. Its sides are taken as the average pilus length. If either the head or the tail of another cell falls within this area, it can be contacted by pili from the black cell. Area II is the corresponding interaction area for A motility. A bent gray cell in direct contact with a dark cell illustrates the bending and alignment due to collisions between cells. Slime trail following is illustrated by trails (light gray shaded area) inside of area II. An artificially low cell density has been used in this figure to clarify the several interactions. In reality, many cells are adjacent to each other within the interaction area.

