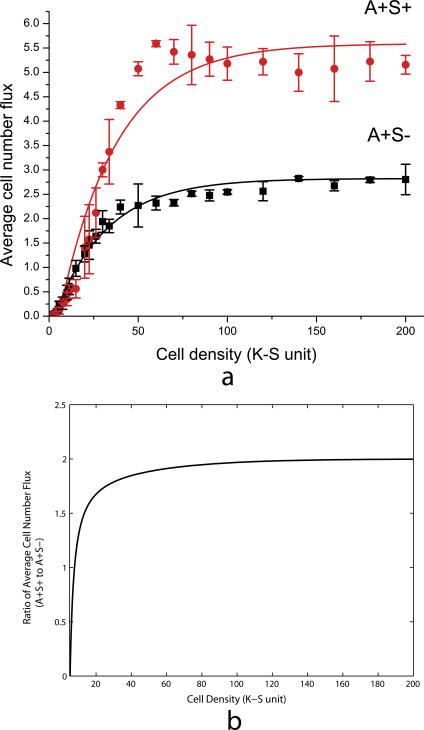
Figure 7. Average Cell Number Flux of Wild-Type and A+S− Mutants.
(A) The average cell number flux data from three simulation runs, with error bars indicating standard deviation. The red dots and black squares indicate results for wild-type cells and A+S− mutants, respectively.
(B) Plot of the ratio of fitting functions f(x) / g(x) against cell density.

