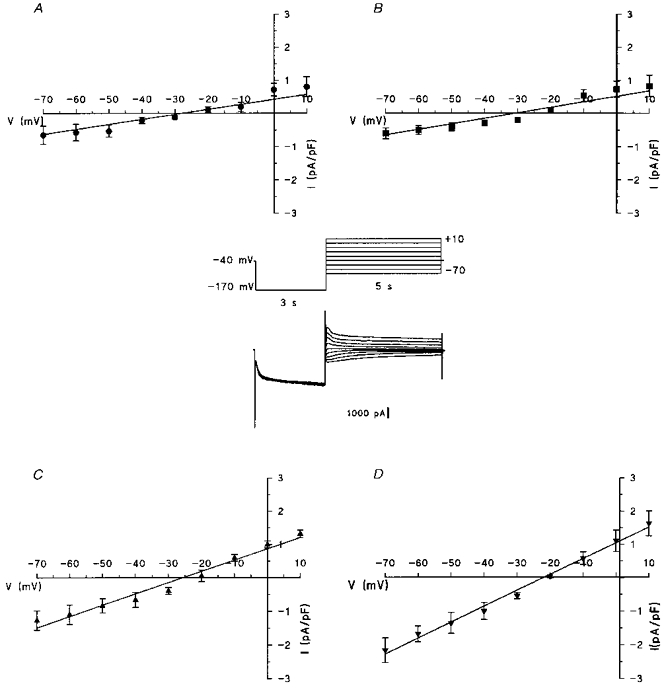
Figure 3. Fully activated I-V relations of If.

The tail current amplitude was measured after a hyperpolarizing pulse of -170 mV, normalized to membrane capacitance and plotted versus voltage values from +10 to -70 mV, for freshly isolated cells (A, n = 7), 4-day- (B, n = 6), 8-day- (C, n = 6) and 12-day-cultured cells (D, n = 10). Data points are means ±s.e.m. Inset, an example of current traces recorded from a 12-day-cultured cell.
