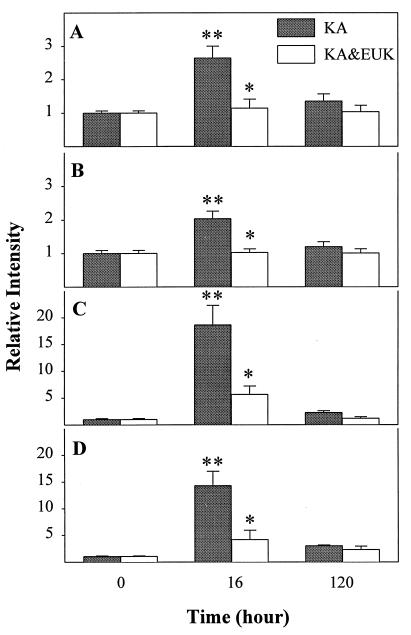
Figure 3.
Quantitative analysis of changes in NF-κB and AP-1 DNA-binding activity after KA treatment. Control and KA-treated rats were killed at 16 h or 5 days after KA injection. The DNA-binding activities of NF-κB (A and B) and AP-1 (C and D) in piriform cortex (A and C) and hippocampus (B and D) were quantified by using imagequant software. Data were expressed as ratios between values found in control and treated animals and represent the means ± SD of six animals in each group. Statistically significant differences between control and KA treatment are indicated by ∗∗, and differences between KA and KA & EUK groups are indicated by ∗.

