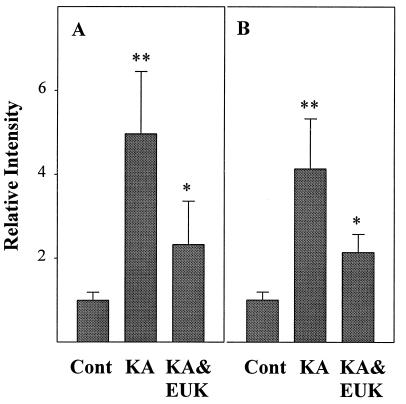
Figure 5.
Quantitative analysis of spectrin proteolysis after KA-induced seizure activity. Control and KA-treated rats were killed 16 h after KA injection. The amount of the 150- and 145-kDa bands in immunoblots stained with antispectrin antibodies was quantified. Data were expressed as ratios between values found in control and treated animals and represent the means ± SD of six animals. Statistically significant differences between control and KA treatment are indicated by ∗∗, and differences between KA and KA & EUK groups are indicated by ∗.

