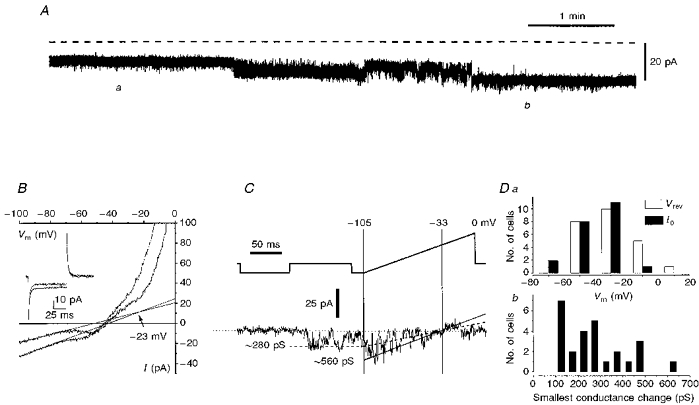
Figure 2. Analysis of the spontaneous current changes observed in voltage clamped IC neurones.

A, a ∼5 min extract of a chart recording of the whole-cell current in an IC granule cell voltage clamped at -80 mV (fluctuations caused by periodic clamp commands have been removed from the trace). The dashed line denotes the zero current level. B, current-voltage (I-V) relations for the cell depicted in A and recorded at the times marked a and b on the trace. The I-V plots were generated by plotting the currents driven by a ramp command from -105 mV to zero (at 0.6 V s−1), against the command potential (see upper trace in C for typical protocol). The linear region of each plot (between -100 and -70 mV) has been fitted with a straight line and the extrapolated intersection of these two lines has been taken to determine the apparent reversal potential of the observed conductance change; the lower conductance state was recorded at position a. Also in B are shown superimposed current traces driven at times denoted by positions a and b, by a 25 mV hyperpolarizing step command for 100 ms. C, faster current transitions in IC neurones. Upper trace (voltage) and lower trace (current) are shown. The current trace was generated by subtracting the average of 11 repeated responses of the granule cell to the indicated voltage protocol, when no fast transitions in current were observed, from a single trace in which a rapid current fluctuation was seen. Two predominant conductance states are indicated, based on the current reversal observed at the holding potential of -33 mV. Da, a plot of the distribution of current reversal potentials values for spontaneous conductance changes (□) and of the distribution of cell resting potentials (▪; as determined by the voltage at which clamp current is zero) in the same population of 22 IC neurones. Db, the frequency distribution of the smallest observed conductance change occurring spontaneously in the population of cells depicted in Da. All the data in this figure are from IC neurones studied in slice preparations; the data collected from the individual cells shown were from experiments in which 0.5 μm TTX and 1 mm Ba2+ were in the bathing medium.
