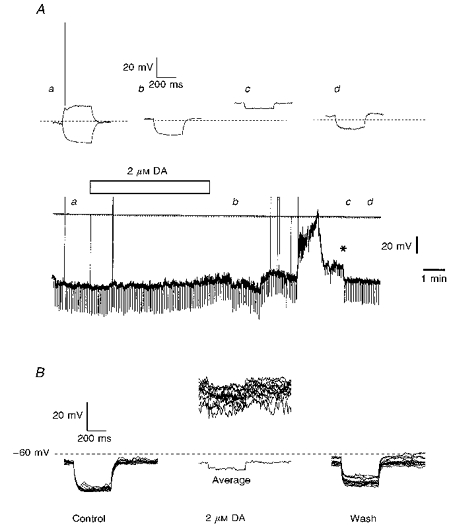
Figure 3. Dopamine-induced depolarizations in IC granule neurones.

A, the lower part of this panel shows a chart record of the membrane potential of an IC neurone together with the representation of the clamping current to which it was exposed. The bar indicates the period for which 2 μm DA was applied to the slice preparation in the bathing medium. Faster voltage traces were caught at the timesindicated on the chart (a-d) and are displayed in the upper part of the panel. They are membrane responses to 10 pA current injections of 400 ms duration; the dotted line indicates a membrane potential of -70 mV. Note the stepwise recovery of the dopaminergic action (*). B, dopamine action is independent of the presence of conventional chemical transmission. Twelve superimposed traces of consecutive voltage responses triggered in an IC neurone by -15 pA current injections are shown before, at the height of dopaminergic action and following washout from the 2 μm DA exposure in ACSF containing no Ca2+ but with added Mg2+ (2 mm), Mn2+ (1 mm) and TTX (0.5 μm). The average of the cell's responses during the depolarization induced by DA is also shown but with a voltage displacement to allow comparison of resistance. Both A and B were slice experiments.
