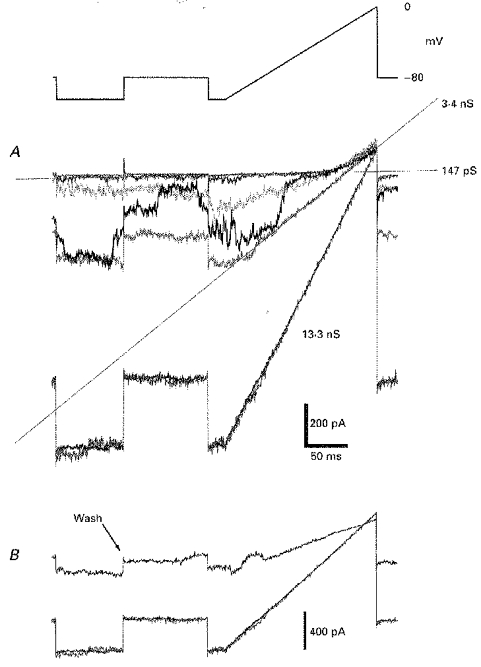
Figure 5. The reversal potential of dopaminergic effects observed in IC neurones.

The upper panel of this figure depicts the voltage protocol imposed on a cell to measure the induced conductance change and its reversal potential. A, these superimposed traces were recorded from a cell before and as it commenced its response to 300 nm DA and are membrane currents driven by the voltage command above, collected at 5 s intervals. The individual traces are bracketed by averages of 12 repeated commands before DA exposure (fitted with the 147 pS conductance line) and after maximal DA-induced conductance was established, 30 s after the onset of the DA response (the 13.3 nS conductance line). The slope of the fourth trace was fitted by a line indicating an intermediate conductance of 3.4 nS. Note the marked transitional conductance states exhibited during the third trace and the progressive migration to less negative potentials of the apparent reversal potential of the response with increasing conductance. B, in this panel are superimposed currents showing the partial recovery from this dopamine application; the trace labelled ‘wash’ was captured 4.5 min after the maximal effect had developed. All these effects were recorded in the presence of 10 μm SCH-23390 in addition to 0.5 μm TTX. Slice preparation.
