
Figure 8. The reversal potential of the maximal D3 agonist effect is unaffected in low external [Na+].
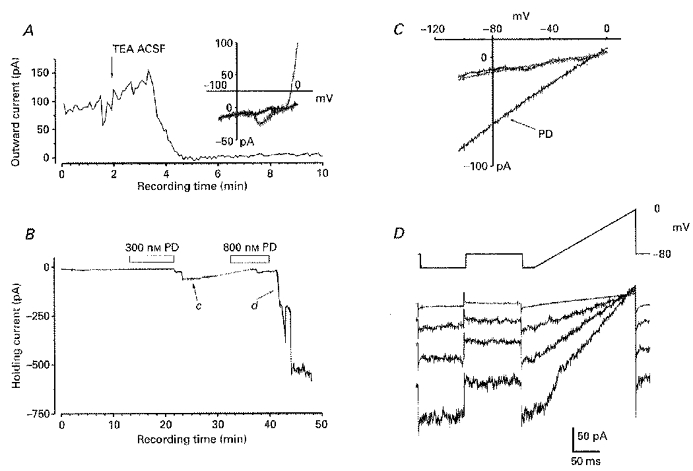
The effects of PD 128907 were tested in ‘TEA ACSF’ which contained no Ca2+, in which 120 mm NaCl was replaced by 120 mm TEA Cl and to which supplementary Mg2+ (2 mm) and Mn2+ (1 mm) was added. A, the main graph shows a plot of the outward current (ordinate) elicited by a ramp depolarization to 0 mV (as depicted in the upper part of D) against experimental recording time (abscissa) for the first 10 min of recording; at the time marked by the arrow the perfusing solution was switched from the normal ACSF to TEA ACSF. The inset graph shows this cell's I-V relation which was acquired before (grey), and 2 min after exposure to the TEA ACSF (black), and was generated by a ramp command from -105 mV to 0 mV. B, the graph shows a plot of holding current (ordinate) required to hold the IC neurone at -80 mV against the experimental recording time (abscissa) and bars indicate when PD 128907 was added to the perfusing medium. The dotted line denotes a break in recording. C, I-V plots for the cell, generated as in A (inset), before, during the inward current that followed exposure to 300 nm PD 128907 (marked PD and from recordings taken at time c on graph shown in B) and after recovery (∼40 min of recording: grey line). D, currents driven by the indicated protocol after the recovery from the first application of PD 128907 (top current trace - an average of 12 responses) and individual traces recorded consecutively at 15 s intervals around the time of the onset of inward current following the second application of PD 128907 (marked d on graph B). The responses shown here were generated in a slice preparation and were notably similar to those obtained in normal ACSF.