
Figure 9. A cell alkalinizing procedure mimics the D3 agonist effects.
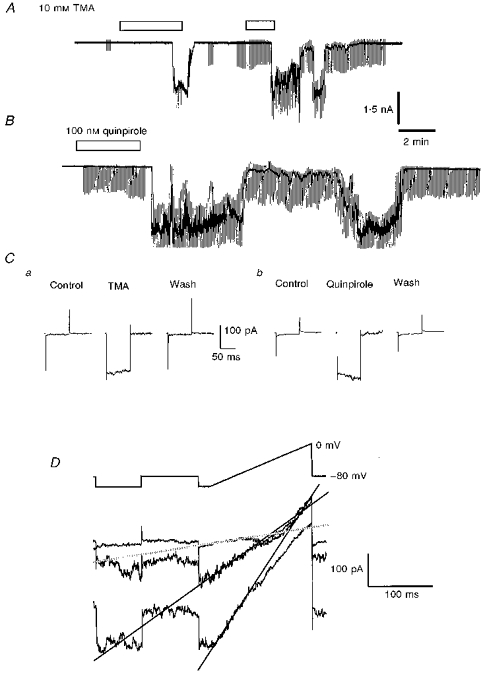
A, a chart record of IC granule cell membrane current at a maintained holding potential of -80 mV with periodic superimposed test voltage-clamp commands, showing currents induced by repeat applications of 10 mm trimethylammonium Cl (TMA) (bars). B, a similar record to that shown in A but depicting the response of another IC neurone to a single application of 100 nm quinpirole. C, conductance measurements for the cells depicted in A (a) and B (b) made by imposing 25 mV hyperpolarizing steps before, at the peak of drug action and following recovery; each trace displayed is the average of 12 current responses driven by the potential commands. D, three superimposed current traces driven by the indicated protocol and acquired from a cell different from that in A, at the start of the inward current elicited by exposure of the slice to 10 mm TMA; lines are fitted to the currents over the range -100 to -70 mV and their intersections give estimates of the reversal potentials of conductance changes (cf. Fig. 5). All examples in this figure were from slice experiments with 0.5 μm TTX present; in the quinpirole experiment the ACSF also included 1 mm Ba2+.