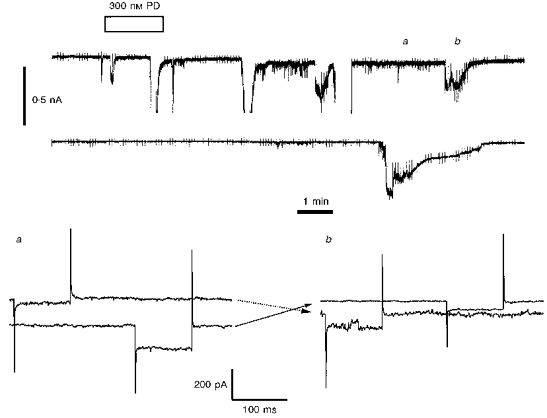
Figure 11. IC neurones which are close neighbours can respond similarly but independently to a D3 agonist.

Upper panel, simultaneous chart records of whole cell currents from 2 neurones in a large isolated clump of IC granules (see Fig. 12). The upper record was from a cell at a holding potential of -80 mV and the lower record from a cell at a holding potential of -60 mV. The application of 300 nm PD 128907 (for the second time) is indicated. Missing sections in the upper trace denote the occurrence of off-scale currents. Lower panel, simultaneous currents recorded in the two neurones at the times indicated a and b including responses to hyperpolarizing commands of -25 mV. In each pair of traces the neurone held initially at -80 mV is the first to be hyperpolarized. The cross-over arrows indicate that as one neurone is subject to a standing inward current induced by the agonist, the other is quiescent, whilst during the recovery phase of the formerly active neurone the other cell starts to develop the agonist-induced response. The ACSF contained 0.5 μm TTX.
