
Figure 12. D3 agonist-induced conductance can be eliminated by breaking intercellular connections.
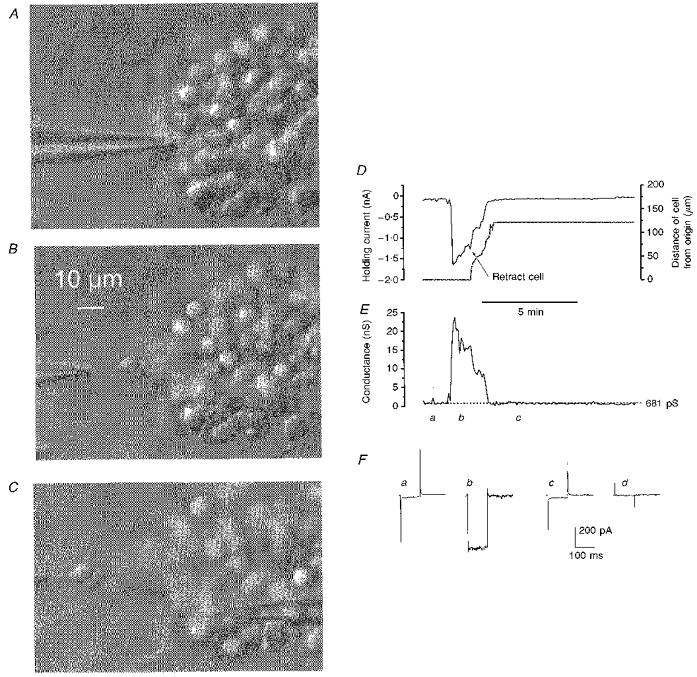
A-C, video grab images of an IC clump showing the removal of an intact granule cell from which whole-cell currents were continuously recorded. These images are of the preparation in which the responses shown in Fig. 11 were recorded, but captured after the cell recorded with the right-hand electrode (holding potential -60 mV and in focus in C) had deteriorated; the electrode on the left-hand side, which was moved away from the clump, thereby isolating the neurone, maintained it at a holding potential of -80 mV. D, simultaneous plots: left ordinate scale, the current required to hold the cell connected to the left-hand electrode at -80 mV; and right ordinate scale, the cell's distance from its original recording site during the separation procedure - both against time (abscissa). The time at which the retraction of the cell commenced is indicated on the graph. E, a plot to the same time scale as D of the retracted cell's conductance. The large conductance increase occurred suddenly 17.5 min after exposure of the preparation to 300 nm PD 128907 and was a continuation of a cycle of repeated inward currents some of which are depicted in Fig. 11, top trace. F, traces of averaged (n = 12) current driven by a 25 mV hyperpolarizing command from -80 mV recordedjust before the conductance increase in E (a), at the height of the increase (b), and following cell removal from the clump (c); d, the subtraction a - c. The ACSF contained 0.5 μm TTX.