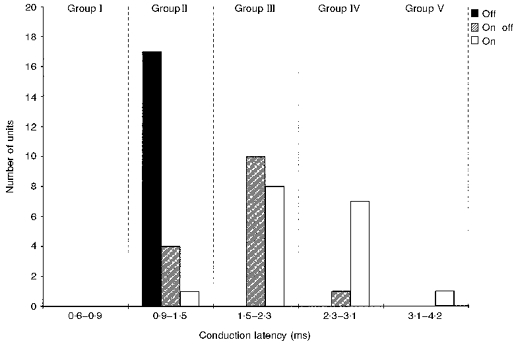
Figure 4. Distribution of centre types among conduction velocity groups.

Histogram shows numbers of off-, on-off- and on-centre units falling into each conduction velocity group. All units were verified as ganglion cells by collision testing.

Histogram shows numbers of off-, on-off- and on-centre units falling into each conduction velocity group. All units were verified as ganglion cells by collision testing.