
Figure 1. Original traces of RABP and RBF.
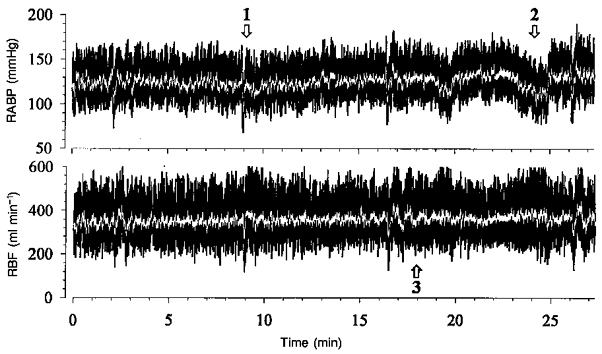
Transfer functions (black traces) and moving averages over 2 s (white traces) calculated from filtered 5 Hz data from one of the 27 min peroids during a control experiment. Note that the spontaneous fluctuations comprise fast changes in RABP, which are paralleled by those of RBF (1). There are also slower fluctuations, which are not followed by RBF (2). Finally, oscillations of RBF can be seen at a cycle length of ∼30 s, which are not present in the RABP (3). Abscissa values in the lower panel apply also to the upper panel.