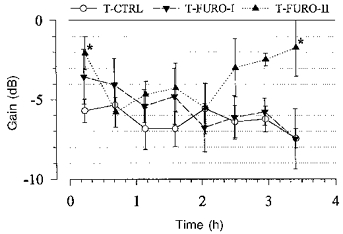
Figure 8. Time course of the transfer gain between 0.0034 and 0.01 Hz.

The gain was averaged between 0.0034 and 0.01 Hz from the single spectra of the eight consecutive blocks. Under the lower dose of furosemide (T-Furo-I, n = 7) there was a slight decreasing trend over time, but at no time was the gain significantly different from that of the control (T-Ctrl, n = 12). Under the higher dose (T-Furo-II, n = 4) the gain increased during the second half of the experiment and was significantly higher than control in the last spectrum. The gain in the first spectrum also was higher than the control. *P < 0.05 vs. T-Ctrl.
