
Figure 7. Variation of the time constant of adaptation with Ca2+ entry.
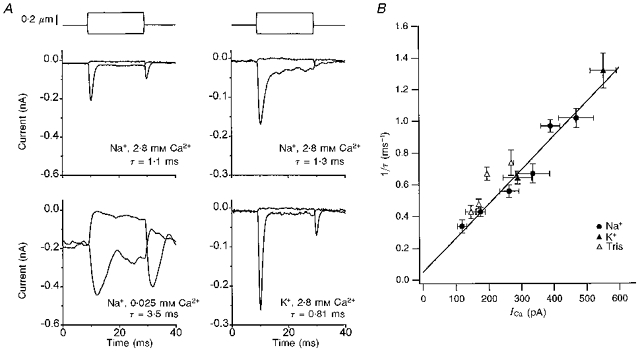
A, effects on the transducer current of reducing endolymphatic [Ca2+] from 2.8 to 0.025 mm in one cell (left), and of replacing Na+ with K+ in a different cell (right). For all 4 examples, averages of 25 responses are superimposed for positive and negative displacement steps, timing shown above the currents. Note that reducing [Ca2+] slows adaptation whereas K+ substitution speeds it up. The adaptation time constants (τ) were obtained from fits to the current decay at the onset of the positive step and the offset of the negative step. All examples are small (less than half-maximal) responses. Maximum currents were: top, 0.65 nA, 2.8 mm Ca2+; 1.05 nA, 0.025 mm Ca2+; bottom, 0.48 nA, Na+, 0.56 nA, K+. B, plot of reciprocal of adaptation time constant against the Ca2+ current, evaluated as the product of the maximum total current and the fractional Ca2+ current, f, in the appropriate ionic condition. Each point is the mean (± 1 s.e.m.) for measurements with the monovalent ion as Na+ (•), K+ (▴) and Tris (▵). The line is a least-squares fit to plotted points, slope, 2.2 ms−1 nA−1; r = 0.97.