
Figure 13. Combined saccade-related cortical activity.
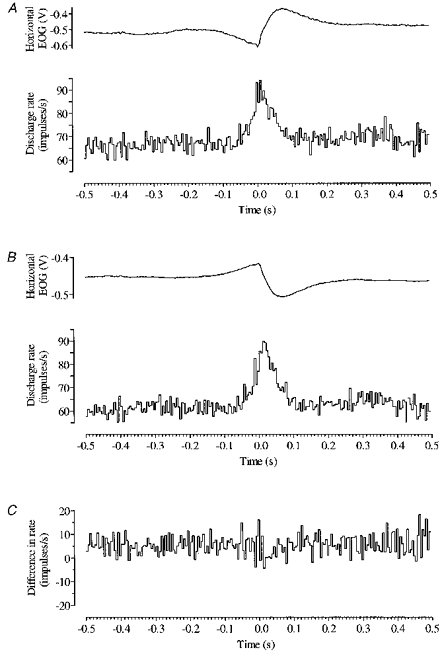
The pooled discharge histogram of all cortical cells whose activity modulated in relation to leftwards saccades is shown in A, and the pooled discharge histogram of all cortical cells modulating in relation to rightwards saccades in B. The difference between the two (A - B) is plotted in C. Each pooled histogram is accompanied (above) by the corresponding pooled saccade profile. Onset of saccade is at time zero. Bin width is 5 ms.