
Figure 1. Broadening of GABAergic IPSCs at depolarized membrane potentials.
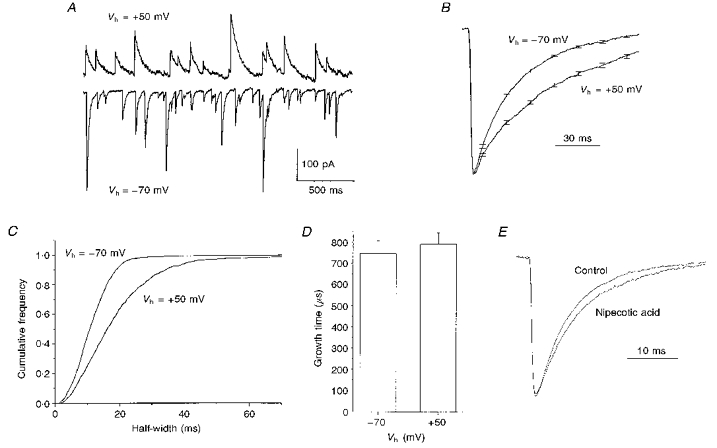
A, spontaneous GABAergic IPSCs recorded from a Cl−-loaded cultured cerebellar granule neurone. The holding potential (Vh) was either −70 mV (bottom) or +50 mV (top). B, mean IPSCs recorded from a typical cell at holding potentials of −70 mV (n = 31) or +50 mV (n = 32). Before averaging, each IPSC was normalized to its peak amplitude. Error bars from the averaging procedure are shown at occasional intervals. C, cumulative frequency plots of IPSC half-widths from a typical cell. In this example and for 5 other cells, the curves derived from data sets recorded at −70 and +50 mV were significantly different (P < 0.01, KS test). D, a graph plotting the mean 20–80% growth times for IPSCs recorded at −70 mV and +50 mV (n = 6). E, peak normalized mean traces from 5 cells recorded before (Control) and following application of 300 μM nipecotic acid. In each cell, 50–100 mIPSCs recorded under each condition were normalized and averaged.