
Figure 4. Depolarization enhances depression in paired agonist applications.
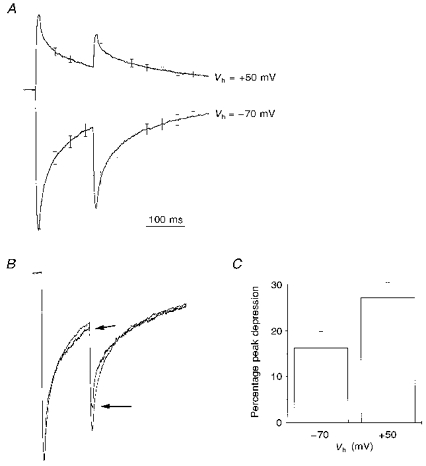
A, mean current traces from experiments in which two 5 ms pulses of 1 mM GABA were applied 150 ms apart. Data from 7 cells recorded at both −70 mV and +50 mV. Averaging was performed as described for Fig. 3A. B, the data from A replotted in order to compare the magnitude of paired pulse depression at −70 mV and +50 mV. The arrows indicate the data recorded at +50 mV. Data averaged as described for Fig. 3B. Error bars are omitted for clarity. C, a graph plotting the percentage depression of the second response with respect to the first for paired agonist applications performed at −70 mV and +50 mV. The depression is significantly greater at +50 mV than at −70 mV (16.2 ± 3.6%, −70 mV, versus27.1 ± 3.3%, +50 mV; P < 0.02, Student's paired t test).