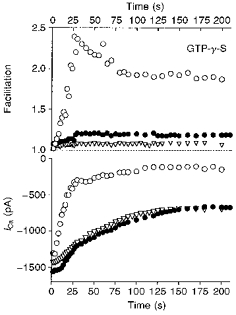
Figure 4. Modulation of ICa by GTP-γ-S in neurones overexpressing βARK1 peptide.

Changes in facilitation (upper panel) and peak Ca2+ currents (lower panel) during dialysis of GTP-γ-S (500 μm) in an uninjected neurone (○), in an uninjected neurone incubated with PTX (1 μg ml−1 for 24 h; ▿) and in a neurone preinjected with 400 μg ml−1βARK1 construct (•). Time 0 refers to the time at which an adequate access resistance was obtained. ICa was elicited by voltage steps from −70 to +5 mV as in Fig. 3.
