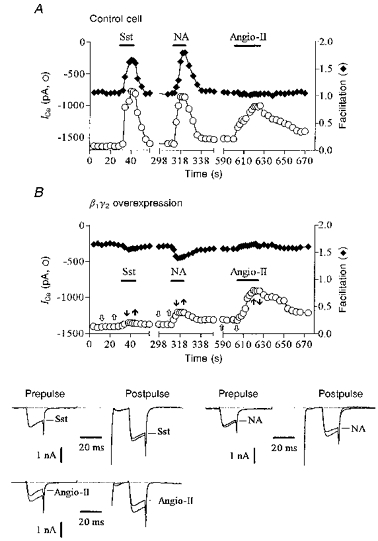
Figure 5. β1γ2 overexpression specifically occludes PTX-sensitive inhibition.

A and B, prepulse ICa amplitude (○) and facilitation (♦) plotted as a function of time in a control neurone (A; preinjected with 800 μg ml−1γ2 construct, 31 pF) and in a neurone co-expressing β1 and γ2 subunits (B; 400 μg ml−1 each of β1 and γ2 constructs, denoted β1γ2, 40 pF). Horizontal bars indicate the time and duration of application of somatostatin (50 nm), noradrenaline (300 nm) and angiotensin II (500 nm). The lower panel in B shows superimposed ICa traces selected before (open arrows) and during (filled arrows) application of agonists as indicated in the upper panel in B. ICa was recorded using the perforated-patch method and evoked using the double voltage pulse as illustrated in Fig. 1. Cells were recorded 24 h after injection.
