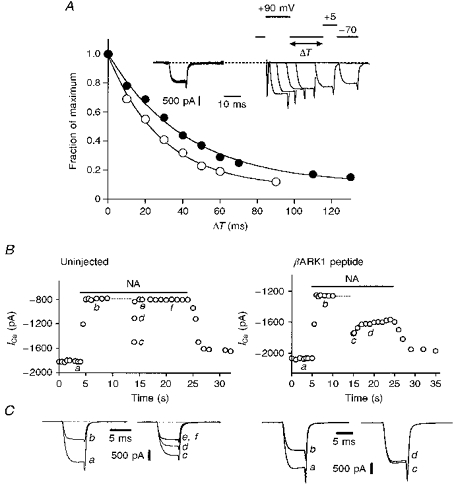
Figure 7. The βARK1 peptide modifies decay of facilitation.

A, representative examples of the decay of facilitation in an uninjected neurone (○) and in a neurone preinjected with 150 μg ml−1βARK1 construct (•) in the presence of 10 μm noradrenaline. Peak currents were normalized to the current measured with a 2.5 ms interval between the conditioning step to +90 mV and the test step to +5 mV. Smooth curves are exponential fits to the data. The inset shows the protocol used to measure the time course of inhibition and some superimposed current trace recordings of the βARK1-expressing cell. B, ICa amplitude plotted as a function of time in an uninjected neurone (left panel) and in a neurone expressing the βARK1 peptide (100 μg ml−1, right panel). The horizontal filled bars indicate the application of 10 μm noradrenaline and the dashed lines the time and duration for which iterative (4 Hz) depolarizations to +90 mV were applied. ICa was activated every 0.5–1 s, except immediately after the +90 mV conditioning depolarization (dashed line) where it was activated 10 ms, 80 ms, 200 ms and 1 s after the offset of the depolarization. Ca2+ currents were recorded in the whole-cell mode and elicited by voltage steps from −70 to +5 mV. C, superimposed current traces selected at the times indicated in B.
