
Figure 2. Inhibition of glutamate transport out of the cell (reversed uptake) by external zinc.
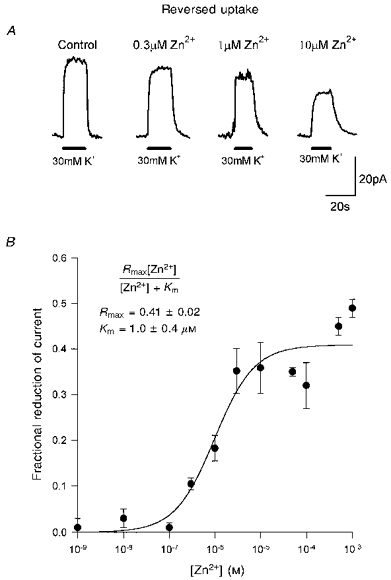
A, specimen data from one cell showing reversed uptake currents, evoked at +20 mV by raising the extracellular potassium concentration (filled bars) from 0 to 30 mm, in the presence of various free zinc concentrations. B, dose-response curve for the fractional reduction of current produced by different doses of zinc (each point shows data (means ±s.e.m.) from 4–10 cells). Smooth curve is a best-fit Michaelis-Menten equation (inset; Rmax is the predicted fractional reduction at a saturating zinc concentration, Km is the concentration giving a half-maximal reduction). The anion conductance of the carrier was not eliminated in this experiment or in those of Figs 3–5, but the similarity of the dose-response curves in Figs 1 and 7A, without and with the anion conductance eliminated, suggests that it has little effect on the results.