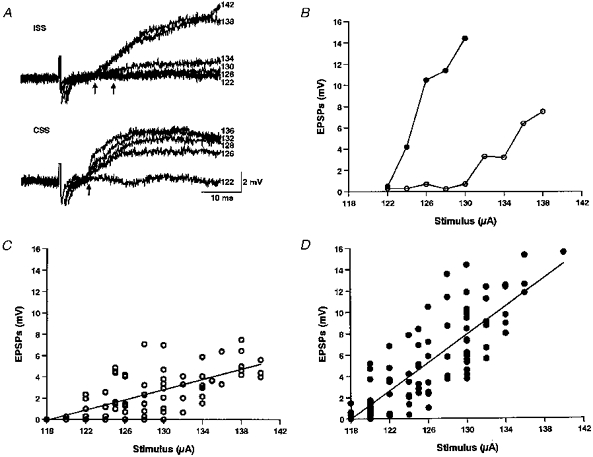
Figure 3. Effect of stimulus intensity on motoneuron EPSPs in 2 μM strychnine.

A, EPSPs from a motoneuron at the 6th postotic segment, where each trace is the average of 10 responses at a particular stimulus intensity. The resting potential was −61 mV. Numbers on the right of traces are stimulus intensities (in μA). B, increase of EPSP amplitude with stimulus intensity in a neuron located at the 6th postotic segment with resting potential of −70 mV. Note the threshold stimulus required to induce EPSPs was lower for the CSS (124 μA; •) than that for ISS (132 μA; ○). At a given stimulus intensity, the CSS-EPSP was always larger than ISS-EPSP. C and D, changes of EPSP amplitude with stimulus intensity for 32 neurons (ISS: 76 traces, r = 0.69; CSS: 92 traces, r = 0.83; each trace was the average of 10 EPSPs) showing the larger EPSPs in the CSS-evoked responses (•) and faster increase with stimulus intensity than in the ISS-responses (○). Regression lines show that for ISS and CSS the EPSPs increase significantly with stimulus strength.
