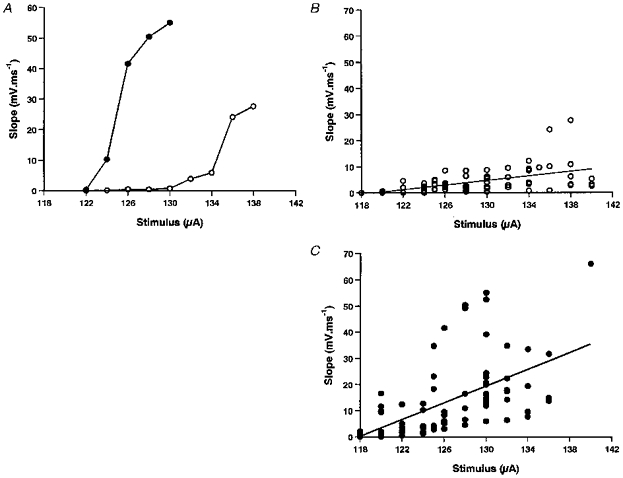
Figure 4. Effect of stimulus intensity on the rising phase of the EPSP.

A, the slope of the rising phase of the EPSP from the same neuron as in Fig. 3B showing how the slope increased with stimulus intensity. Note again that the rising slope of CSS-EPSPs increased more rapidly than those of ISS-EPSPs. B and C, pooled data showing the effects of stimulus intensity on EPSP slope for the same 32 neurons as in Fig. 3C and D. EPSP slope increases significantly in both cases and is greater for CSS than ISS.
