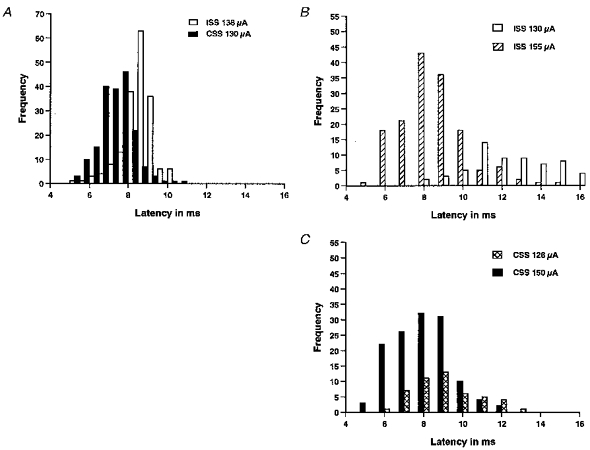
Figure 5. EPSP latencies and the effects of stimulus intensity.

A, latencies of 3–5 mV ISS- and CSS-EPSPs in a neuron at the 6th postotic segment. Latencies of 179 EPSPs to ISS (open bars) and 187 EPSPs to CSS (filled bars) were measured. Resting potential was −70 mV. B and C, changes of EPSP latencies with stimulus intensity in the same neuron. B, latencies of ISS-EPSPs evoked at 1 Hz by two different intensities (open bars, 130 μA, 70 traces; hatched bars, 155 μA, 152 traces). The latencies decreased as the stimulus intensity was increased (P < 0.001). C, latencies of CSS-EPSPs at two different intensities (crosshatched bars, 128 μA, 48 traces; filled bars, 150 μA, 130 traces). There was a small decrease in the latencies (P < 0.05).
