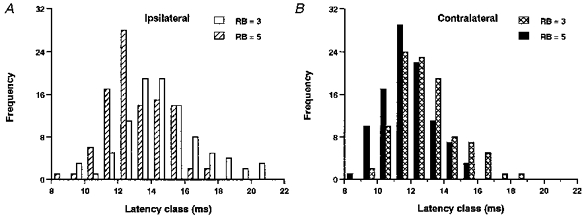
Figure 11. Simulated EPSP onset latencies in a series of 100 experiments with introduced variation (see Table 2).

A, EPSP onset latencies in ipsilateral motoneurons in response to ‘weak’ stimulation (3 RB neurons, open bars) and ‘strong’ stimulation (5 RB neurons, hatched bars). Stronger stimulation leads to shorter latencies and a reduction in variance. B, EPSP onset latencies in contralateral motoneurons in response to ‘weak’ stimulation (crosshatched bars) and ‘strong’ stimulation (filled bars). Latencies shorten but there are no changes in variance as stimulation intensity is increased.
