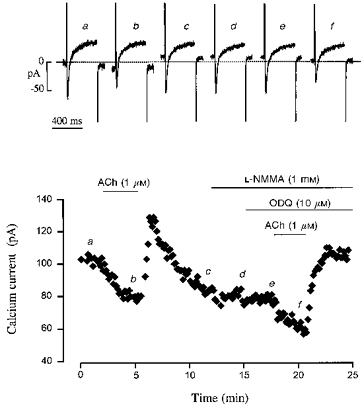
Figure 1. Effect of ACh on basal ICa in a human atrial myocyte.

Each symbol on the graph corresponds to a measure of ICa at 0 mV, obtained every 8 s. The cell was first superfused with control solution and then exposed to the drugs during the periods indicated by the bars. 1 μM ACh alone, or together with ODQ (10 μM) + L-NMMA (1 mM) produced the same inhibition of ICa, which was followed in both cases by a rebound stimulation of the current. The individual current traces shown in the upper part of the figure were obtained at the times indicated by the corresponding letters in the bottom graph. The dotted line indicates the zero current level.
