
Figure 4. Zn2+ effects on macroscopic current fluctuations of α1β2γ2 receptor.
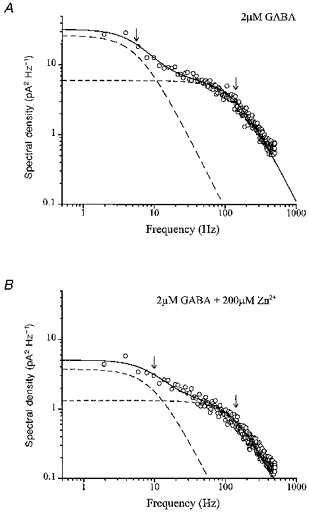
A, power density spectrum of steady-state macroscopic current activated by 2 μM GABA from a single cell expressing α1β2γ2 subunits. Smooth continuous curve represents the sum of two individual Lorentzian functions (dashed lines) with corner frequencies of 5.8 and 137 Hz (arrows). B, power density spectrum of steady-state macroscopic current activated by 2 μM GABA in the presence of 200 μM Zn2+ from the same cell. Corner frequencies are 9.6 and 136 Hz (arrows).