
Figure 6. Responses from gating models.
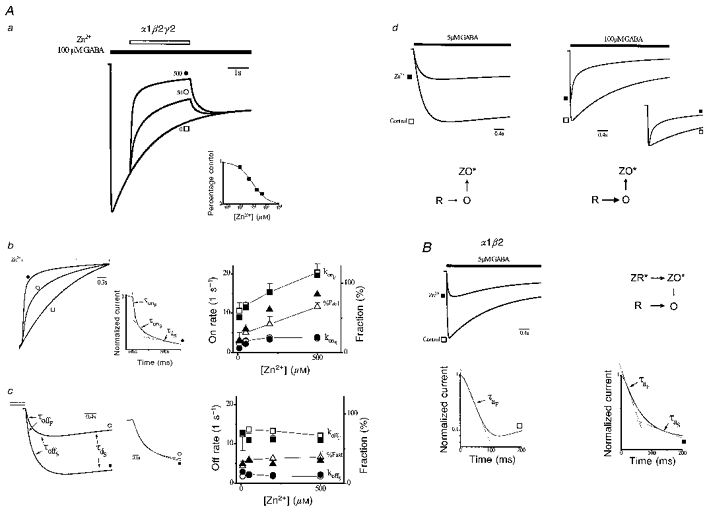
Aa, responses from α1β2γ2 gating model (see text) to Zn2+ application (open bar, concentrations adjacent to response in μM) of currents preactivated by GABA (filled bar). Inset, current in Zn2+, as percentage of control, versus Zn2+ concentration and the fit by the inhibition equation (smooth curve, IC50= 94 μM, S= 0.77). Ab, left, normalized time courses of inhibition onset replotted from Aa (symbols identify responses). Middle, onset time course normalized to unity and plotted on semilogarithmic axes (500 μM Zn2+). Time course is triexponential with each component indicated by dashed straight lines labelled with associated time constants (reciprocal of respective rates: fast (τonF) and slow (τonS) inhibition onset and slow desensitization (τdS)). Superimposed line is fitted by a triexponential function (parameters: AonF= 0.47, konF= 18 s−1, AonS= 0.16, konS= 2.5 s−1, AdS= 0.17, kdS= 0.22 s−1, B = 0.04). Right, concentration- response relationships for fitted parameters from gating model (filled symbols) and empirical responses replotted from Fig. 5Ab (open symbols). Ac, time courses of inhibition offset replotted from Aa, shifted in magnitude to align currents at the end of the Zn2+ application (open bar). Time courses are well fitted by a triexponential with each component labelled by the associated time constant (reciprocal of respective rates: fast (τoffF) and slow (τoffS) inhibition onset and slow desensitization (τdS)). Middle, normalized offset time courses replotted on an expanded time scale. Right, concentration-response relationships for offset parameters from gating model (filled symbols) and empirical responses replotted from Fig. 5Ac (open symbols). Ad, α1β2γ2 model responses triggered at low (5 μM) and high (100 μM) GABA concentrations (bar) in control (□) and in constant Zn2+ (300 μM, ▪) with vertical scaling adjusted to normalize for peak control currents. Dominant model gating pathways are shown below responses where rate magnitudes are related to the emboldening and length of transition arrows and ZX* represents Zn2+-bound states (ZX, ZXS and ZXF) associated with state X (X = R, O, or D). B, α1β2 model responses at 5 μM GABA (bar) in control (□) and in the presence of Zn2+ (10 μM, ▪) with dominant model gating pathways shown adjacently. Below, semilogarithmic plot of onset time courses from above normalized to peak current magnitude. In control, activation is described by a single fast exponential (dashed line, time constant, τaF). Zn2+ adds a second slow exponential component to activation (time constant, τaS). The sum of the fitted triexponentials (superimposed line; AonF= 0.31, konF= 19 s−1, AonS= 0.11, konS= 3.4 s−1, AdS= -0.31, kdS= 0.54 s−1, B = 0.87) describes the activation time course (see text).