
Figure 5. The decrease in recovery induced by intracellular E2-BSA was dose dependent.
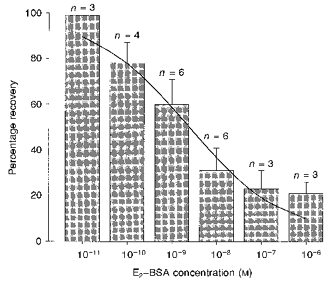
The decrease in recovery was evident at 0.1 nM and was saturated at 0.1 μM. A Hill plot derived from the dose-response data gave an EC50 of 2.51 ± 3.18 nM and an nH of 0.39 ± 0.07. Prolongation of cAMP action is described as the percentage recovery at 15 min after removal of 8-bromo-cAMP. It should be noted that a persistent recovery (about 20 %) existed independent of E2-BSA concentration. n indicates the number of the cells tested.