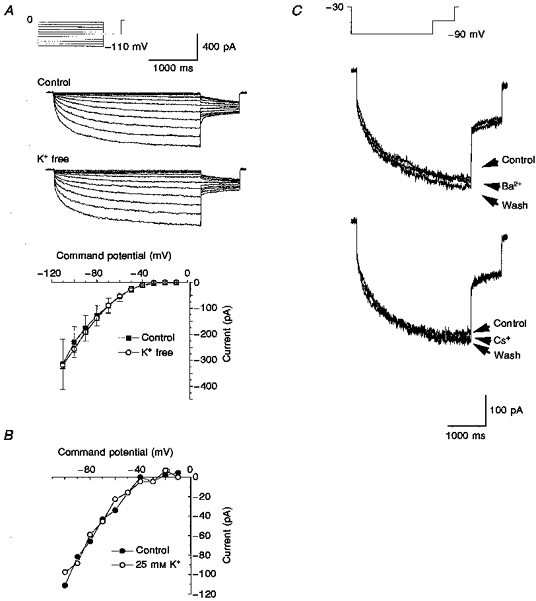
Figure 1. A non-cationic hyperpolarization-activated current in SCG neurons.

A, current traces in control and K+-free solutions were generated by applying hyperpolarizing voltage steps from between -10 and -110 mV for 3 s from a holding potential of 0 mV followed by a 0.8 s step to -60 mV once every 10 s. The graph shows mean current-voltage relationships for time-dependent current in control (▪) and K+-free (○) solutions. Data are means ±s.e.m.; n= 7 for control, n= 24 for K+-free solution. B, current-voltage relationships in control (•) and 25 mM K+ (○) solutions in a single cell. C, currents obtained in the presence and absence of 10 mM Ba2+ or Cs+ ions were evoked by 3 s steps to -90 mV from a holding potential of -30 mV followed by a 0.8 s step to -60 mV once every 10 s.
