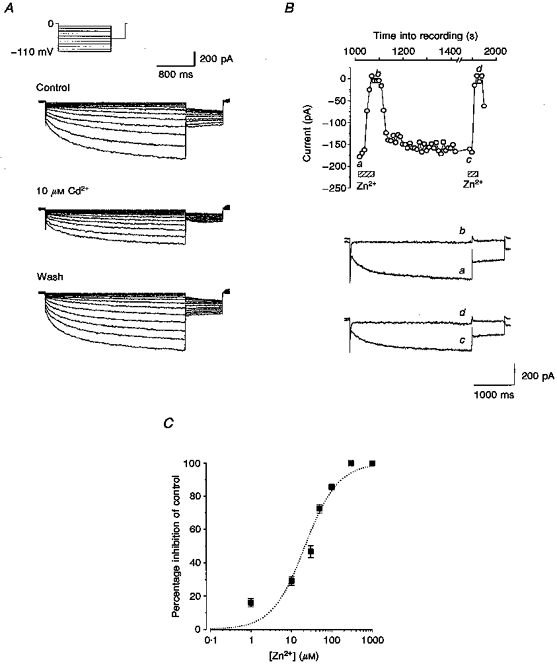
Figure 3. ICl,IR is blocked by Cd2+ and Zn2+.

A, currents evoked by the same voltage protocol as Fig. 1A were obtained in control solution, in the presence of 10 μM Cd2+ and after wash. B, 300 μM Zn2+ completely and reversibly inhibits currents evoked by the same voltage protocol as Fig. 2B. Current traces a-d were recorded at the time points indicated. Internal solution contained 10 mM BAPTA and cell dialysis of 15 min had occurred before the data were recorded. C, concentration-response curve for inhibition by Zn2+ at -90 mV. Data for concentrations between 1 and 1000 μM (means ±s.e.m.; n=3 or 4 for each point) are fitted by the Hill equation with slope constrained to 1, giving an IC50 of 23 μM.
