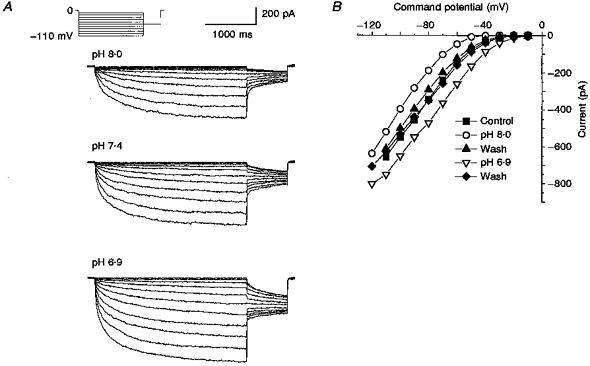
Figure 5. Effect of changes in extracellular pH on ICl,IR.

A, current traces generated using the protocol described for Fig. 1A in pH 8.0, 7.4 and 6.9 external solutions. B, plot of current-voltage relationships in control (pH 7.4), pH 6.9 and pH 8.0 external solutions together with two washes in control external solution.
