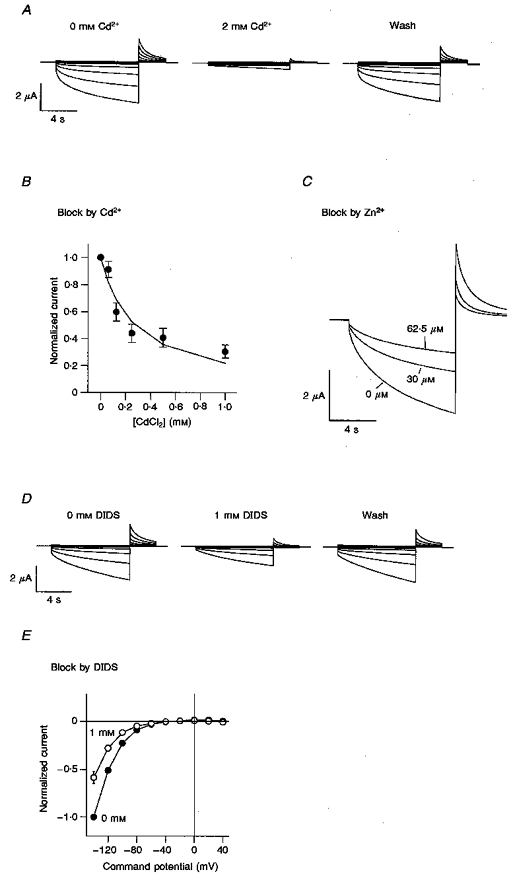
Figure 8. ClC-2 is blocked by Cd2+, Zn2+and DIDS.

A, voltage clamp traces from an oocyte expressing rClC-2 before (left) and after a 1 min perfusion with 2 mM Cd2+ (middle) and after 3 min wash (right). Voltage was clamped for 9 s at values between +40 and -140 mV in steps of 20 mV from a holding voltage of -30 mV, followed by a 3 s step to +40 mV. B, block of ClC-2 by increasing concentrations of Cd2+ using the same voltage protocol as Fig. 8A except with a constant test step to -120 mV. Normalized data from 5 oocytes are shown. The IC50 is 280 μM when fitted with a Hill equation with slope constrained to 1. C, block of ClC-2 by Zn2+ using the same voltage protocol as Fig. 8B. Traces are shown in control and in the presence of 30 and 62.5 μM Zn2+. D, voltage clamp traces from an oocyte expressing rClC-2 before (left) and after a 1 min perfusion with 1 mM DIDS (middle) and after 3 min wash (right) using the same voltage protocol as Fig. 8A. E, current-voltage relationships obtained from 4 cells in the absence or presence of 1 mM DIDS. Currents have been normalized to the currents at -140 mV in the absence of DIDS.
