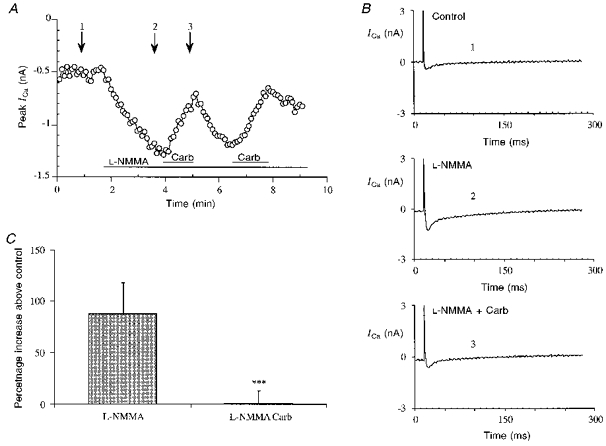
Figure 5. Carbachol reversion of the L-NMMA stimulatory effect on basal ICa.

A, typical calcium current time course in a cell stimulated with L-NMMA (1 mM) and then with L-NMMA plus carbachol (Carb, 1 μM). Experimental protocol as in the previous figures. The carbachol application was repeated to show the reversibility of the effects. B, single traces of ICa at the times indicated by the arrows in A: control (1), L-NMMA (1 mM) (2), L-NMMA (1 mM) and Carb (1 μM) (3). C, bar graph showing the increase of basal ICa stimulated by L-NMMA and the return close to control with L-NMMA and carbachol (***P < 0.001 vs. L-NMMA alone).
