
Figure 7. Phase-plane analysis of relaxation.
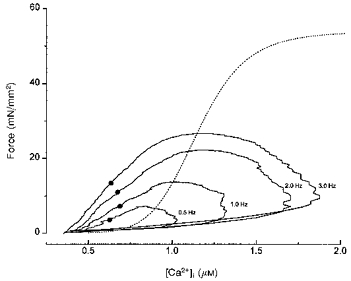
Twitch forces vs. corresponding [Ca2+]i from a mouse trabeculum at different stimulation frequencies ([Ca2+]o, 2.0 mM) are plotted to generate phase-plane plots. The steady-state force-[Ca2+]i relation of this muscle is superimposed (dotted line). The points (•) indicate 50 % of peak force during relaxation. Please note that the distance between the points and the corresponding levels of force of the superimposed steady-state force -[Ca2+]i relation (designated as Δ[Ca2+]i (Gao et al. 1995)) increases at higher stimulation frequencies.