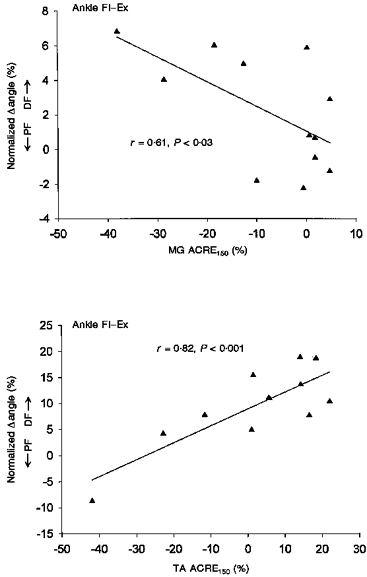
Figure 2. Regression plots between MG (top) and TA (bottom) and ankle kinematics after high intensity stimulation for all subjects.

MG data is from mid-stance (part 5) and TA is from mid-swing (part 12). Significant regression is as indicated by the continuous lines.
