
Figure 7. Normalized second, third and fourth EPSP amplitudes plotted against the time interval following the first spike in the train.
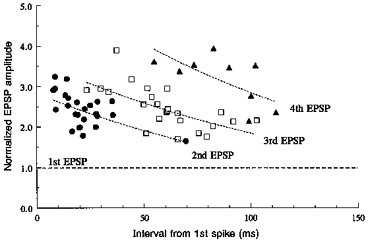
Data subsets used for these points each include EPSPs recorded from a single pair, at one membrane potential and with a relatively narrow range of interspike intervals. The mean interval for each data set is plotted. The s.d.s about the mean were < 4 ms for intervals < 20 ms and up to 10 ms for the longest intervals. Normalized mean EPSP amplitude is plotted for each subset (n, 20-60), e.g. the mean amplitude of the second EPSP divided by the mean amplitude of the first EPSP for that subset. c.v.s for these EPSPs were large, 0.84 ± 0.37 for the first EPSPs and 0.47 ± 0.24 for second EPSPs. Double log regression lines are indicated by the dotted lines. Correlation coefficients were, however, low (0.7 > r > 0.6) and these lines simply represent the trend.