
Figure 8. Normalized c.v.−2 plotted against normalized mean EPSP amplitude for second and third EPSPs in brief trains.
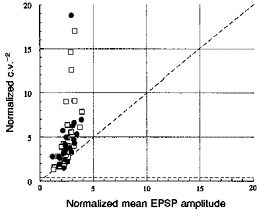
For each data subset (see Fig. 7 legend) mean second (•) or third (□) EPSP amplitude and c.v.−2 were normalized using the mean and c.v.−2 of the first EPSP for that data subset. The majority of points lie above the line of slope 1, indicating that the facilitation was due to an increase in the probability of release.