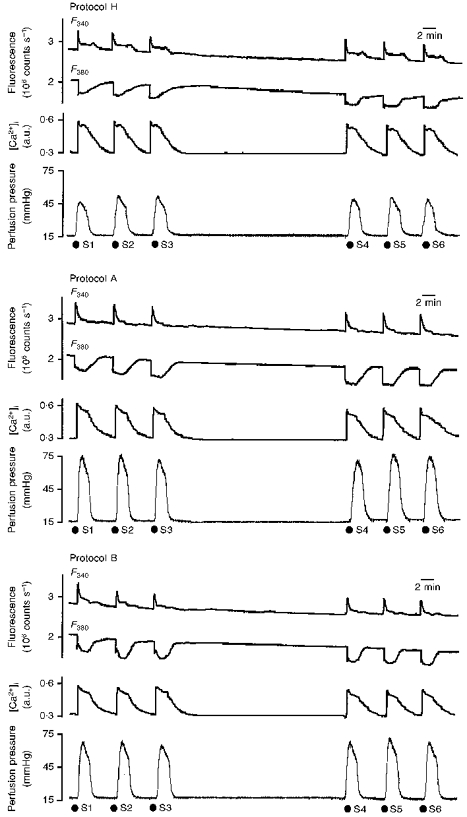
Figure 3. F340 and F380, [Ca2+]i and vasoconstriction following noradrenaline (S1-S6) in protocols H (top), A (middle) and B (bottom).

Each panel shows original recordings of changes in fluorescence (excitation wavelengths, 340 nm (F340) and 380 nm (F380)) of the intracellular [Ca2+]i-sensitive dye fura-2 (upper records), calculated [Ca2+]i (middle records), and perfusion pressure at constant flow rate (bottom records) following intraluminal perfusion of noradrenaline (S1-S6, 3 μM, 2 min).
