
Figure 4. Developmental profile of the ENOs.
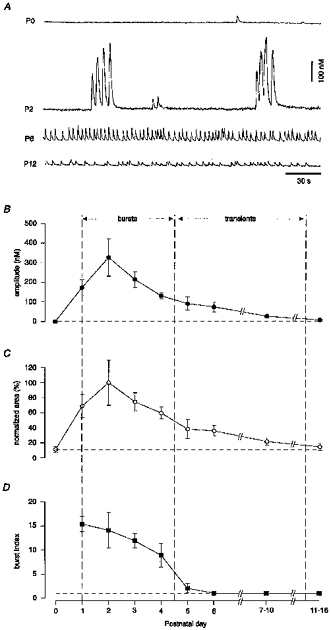
A, the traces show representative oscillatory Ca2+ transients recorded from individual fura-2 AM-loaded pyramidal neurones in slices from P0, P2, P6 and P12 rats. Note the large amplitudes and the burst-like appearance of the oscillatory Ca2+ transients at P2. B, averaged data showing the amplitude of the spontaneous Ca2+ transients plotted against postnatal age. C, a similar plot showing the developmental profile of the integrated [Ca2+]i elevations (area under the Ca2+ transients). The area measurements were normalized with respect to the maximal mean value obtained at P2. The dashed horizontal line in C represents the mean (n= 8 cells) normalized area obtained when all activity was blocked by bicuculline (cf. Fig. 9). D, the burst index, obtained by dividing the intraburst frequency with the interburst frequency, plotted against postnatal age. When no bursts were detected, that is when the activity was regular, this ratio became 1 (horizontal dashed line). Data points represent averaged values from 4, 6, 8, 8, 8, 6, 4, 7 and 7 slices prepared from rats at P0, P1, P2, P3, P4, P5, P6, P7-P10 and P11-P16, respectively. The value for each of these slices was obtained by evaluating recordings of at least 5 min duration from at least 3 active neurones. Non-active slices were not included in the calculation of burst index. Thus, P0 is not represented, 5/7 slices represent P7-P10 and 2/7 slices represent P11-P16. The vertical dashed lines subdivide the period during which ENOs are present into one when burst activity predominates and one when regular activity predominates.