
Figure 5. Pure cytosolic free [Ca2+] estimated by contraction signal.
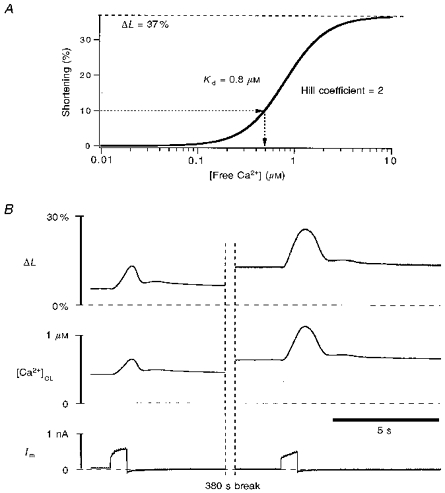
A, model of the Ca2+ dependence of cell contraction in ventricular myocytes, based on Bassani et al. (1995), with slight modification in parameters (see text and eqn (18)). This model was used in B for ‘back’ calculation of cytosolic [Ca2+]c. B, the ferret cell was stimulated by repetitive depolarization pulses to +110 mV, two of which are shown here. Not shown are five pulses during the 380 s break, which increased the resting Ca2+ level. The cytosolic Ca2+ is calculated from the contraction signal, ΔL, using eqn (18) as in A. The subscript ‘CL’ replaces ‘c’ for [Ca2+]c estimations based on cell length ([Ca2+]CL). The cytosolic indo-1 in this cell was quenched by 0.7 mm Mn2+ in the bath.