
Figure 12. Delay of [Ca2+]m compared with [Ca2+]c.
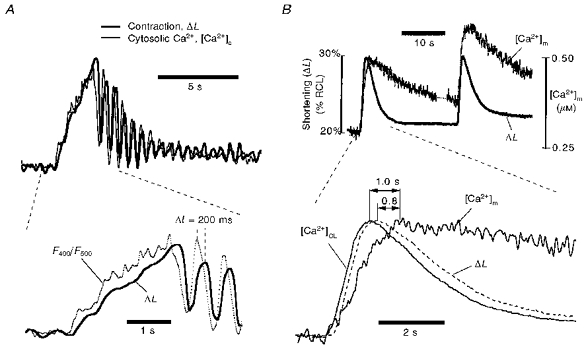
A, delay of cell contraction (ΔL) after depolarization-induced changes in cytosolic calcium concentration, [Ca2+]c (expanded version of part of Fig. 8). Note the oscillating peaks of [Ca2+]c, recorded by indo-1 fluorescence, precedes that of ΔL. The latency of ΔL is about 200 ms. Since Ru360 blocks mitochondrial Ca2+ uptake, F400/F500 reports only cytosolic Ca2+. There was no Mn2+ in the bath but 0.2 μm Ru360 in the pipette to block mitochondrial Ca2+ uptake. B, delay of mitochondrial [Ca2+]m after depolarization-induced cell contraction in another ferret cell without Ru360. Note the depolarization-induced [Ca2+]m is preceded by cell contraction (shown as percentage of resting cell length, RCL). The latency of [Ca2+]mvs. contraction was 0.8 s. Addition of the 200 ms delay between [Ca2+]c and contraction (A) makes the total delay of [Ca2+]mvs.[Ca2+]c about 1 s. Mn2+ (0.7 mm) was in the bath to quench cytosolic indo-1.