
Figure 13. Real time Ca2+ influx into mitochondria.
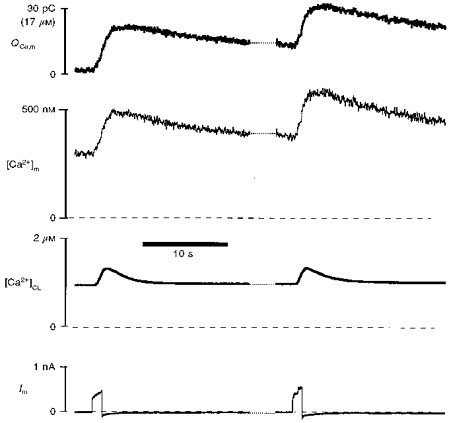
Depolarization to +110 mV was applied to a ferret cell with Mn2+ quench of cytosolic indo-1. [Ca2+]m and [Ca2+]CL are estimated by ΔL and mitochondrial indo-1 fluorescence using eqns (7) and (18), respectively. The net mitochondrial Ca2+ influx, QCa,m, was measured by the Ca2+-sensitive indo-1 signal, ΔFd (see eqn (17)). Scale for QCa,m is given in both Ca2+ charge (30 pC) and total mitochondrial Ca2+ concentration (17 μm), assuming a total mitochondrial volume of 9 pl for this cell.