
Figure 3. Tension redevelopment following quick release in slack test measurements of Vo.
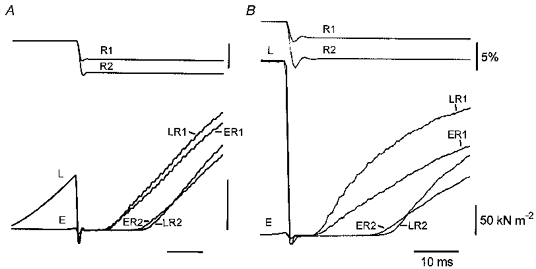
A and B are from different fibres. A fibre contracted isometrically until it was released and allowed to shorten rapidly for different distances, each of which was more than sufficient to bring the force to zero. The fibre then redeveloped tension at the new length. Each panel compares force redevelopment following a pair of releases (R1, R2) early in contraction (traces marked E) with those following later releases (traces marked L). The traces have been positioned horizontally such that the early and late releases are aligned. In A the early releases occurred when the force had reached approximately 0.5 %Fo and the later releases when the force reached 24 %Fo. In B the force was 1.9 %Fo at the early releases, and the late releases were during the plateau of the contraction.