
Figure 9. Force-velocity relationships 20 and 200 ms after force onset calculated from the Huxley model.
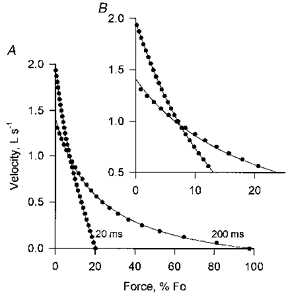
B is an expanded version of the upper left portion of A. These results were obtained with isovelocity shortening which began at the onset of stimulation. τon = 20 ms. The calculated values are shown as points; the continuous lines are Hill curves fitted to these points. This figure shows that (1) a Hill curve provides a reasonable fit to calculated values even when activation time is made part of the model, and (2) the Huxley model predicts elevated shortening velocity at low force early in a contraction.