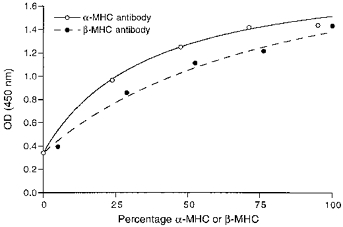
Figure 1. Calibration curves for the ELISA.

Hypothyroid (100 %β-MHC) and euthyroid (95 %α-MHC and 5 %β-MHC) rat heart samples were mixed in the same proportions as in Fig. 2B to obtain standard samples with known percentages of α- and β-MHC. The percentages of α- and β-MHC in the hypothyroid and euthyroid rat hearts were quantified by separating the MHCs in SDS-PAGE and subsequent densitometric analysis of the bands (see Methods). Hyperbolic relations were fitted to the data points as described in the text.
